Table of Contents
Table of Contents |
|
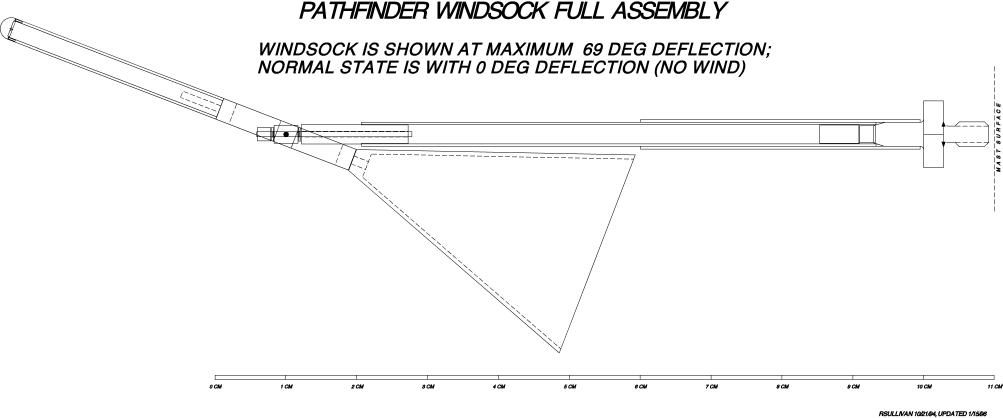
Three IMP windsock units were mounted on the ASI/Met mast at heights of 33.1, 62.4, and 91.6 cm above the solar panel. Total mass of all three devices together, including mounting struts, was 39g. The IMP windsocks functioned like conventional terrestrial windsocks in that deflection from vertical indicates wind speed, and azimuth of deflection indicates wind direction. Each windsock consisted of a hollow aluminum cone rigidly joined to an aluminum-sheathed steel counterweight spike, which together pivoted on a small, low-friction gimbal mount. Each windsock assembly was less than 10 cm long and was mounted (flexibly) at the end of a support strut extending 10 cm from the ASI/Met mast. The final design was tested in the field and in a wind tunnel at one atmosphere, and at equivalent Martian atmospheric pressure in the ASU low-pressure wind tunnel at NASA-Ames, and found to be aerodynamically stable at all deflection angles and wind speeds. Each windsock unit was constructed of electrically conductive materials and was grounded to prevent accumulation of static charge from affecting windsock deflection. Matte finishes on the aluminum cones and counterweight sheaths produced a very bright appearance in IMP images (conductive black paint was added to the cone interiors for contrast), so that sharp contrast between bright windsock components and darker scene backgrounds helped maintain integrity of the windsock appearance in compressed images.
Wind speed u is related to windsock deflection  by equating gravitational and aerodynamic
torques acting on the windsock
by equating gravitational and aerodynamic
torques acting on the windsock

[Equation 1]
where R1 = distance between pivot
and center of mass, M = non-counter-balanced mass, g
= acceleration of gravity, R2 =
distance between pivot and center of aerodynamic pressure,
Ad = effective aerodynamic cross-section, and
 = atmospheric density (a
function of pressure, temperature, and molecular weight).
Counterweight length was adjusted until
R1/R2
was optimized for sensitivity to Martian wind speeds appropriate for
investigation of aeolian processes. In practice, it is not necessary
to calculate R1,
R2, M, and
Ad (which varies with ) individually. Eq. [1] allows windsock
performance at the same deflection
(thus same Ad) in different atmosphere/gravity
environments to be related. If the windsock is deflected 1 degrees under
two different conditions of wind speed, atmospheric density, and
gravity, then eq. [1] reduces to
= atmospheric density (a
function of pressure, temperature, and molecular weight).
Counterweight length was adjusted until
R1/R2
was optimized for sensitivity to Martian wind speeds appropriate for
investigation of aeolian processes. In practice, it is not necessary
to calculate R1,
R2, M, and
Ad (which varies with ) individually. Eq. [1] allows windsock
performance at the same deflection
(thus same Ad) in different atmosphere/gravity
environments to be related. If the windsock is deflected 1 degrees under
two different conditions of wind speed, atmospheric density, and
gravity, then eq. [1] reduces to
[Equation 2]
This means that if u is known at 1 for conditions
g and , then
u for other specified conditions of g and can be immediately calculated for the
same deflection 1. In the general
case, once the windsock unit is calibrated for u vs. at conditions g and , then u vs. for the same deflections can be predicted
for other specified conditions of g and . This relationship was exploited for
calibration and derivation of wind speed on the Martian surface.
Science Background
The importance of aeolian activity on the surface of Mars has been well established by telescopic observation, analysis of spacecraft imagery, and experimental work. Variability of Martian surface features has been recorded telescopically since the nineteenth century, although it was not fully appreciated until the advent of spacecraft exploration that variability of the planet's surface markings was due primarily to wind-related changes [MCLAUGHLIN1954; KUIPER1957; SAGAN&POLLACK1969]. Regional dust storms can occur in many locations any time during the Martian year, while global, planet-encircling dust storms originate only during southern spring and summer [MARTIN&ZUREK1993]. A planet-encircling dust storm occurs about once every three Martian years, with significant interannual variation [HABERLE1986; ZUREK&MARTIN1993]. Such a storm was in progress when Mariner 9 arrived at Mars in 1971. As the storm abated, surface features were observed that obviously derived from wind interactions with the surface, including time-variable bright and dark streaks associated with topographic obstructions, and dune fields [e.g., SAGANETAL1972; MCCAULEY1973]. Changes in variable feature characteristics during the period spanning the Mariner 6, 7, 9, and Viking missions indicate that albedo variations on Mars are due solely to aeolian effects (and sublimation/deposition of volatiles at the poles) [e.g., VEVERKAETAL1974; VEVERKAETAL1977]. Viking Orbiter images revealed four major regions of dunes surrounding the north pole [CUTTSETAL1976; BREEDETAL1979; TSOARETAL1979; THOMAS1981; LANCASTER&GREELE1990]. Smaller deposits of dune-forming materials are common in high resolution Viking images, especially within craters and other topographic traps [e.g., BREEDETAL1979; THOMAS1981; THOMAS1984]. Barchan, star, transverse, and longitudinal dunes have been observed and their morphologies and orientations used to interpret regional wind patterns [e.g., TSOARETAL1979; BREEDETAL1979; WARD&DOYLE1983; EDGETT&BLUMBERG1994; THOMAS&GIERASCH1995; LEE&THOMAS1995]. It is not clear whether any of these dune forms are currently active. Dune particles are presumably sand-sized [EDGETT&CHRISTENS1991] but their composition has not been determined. Wind tunnel experiments indicate improbably strong winds are required for direct entrainment of dust-sized particles under Martian conditions [GREELEYETAL1980; GREELEY&IVERSEN1985], so the mechanism for raising massive quantities of dust during regional and global dust storms must be complex, perhaps involving saltation and traction of larger, more easily moved particles as a triggering mechanism, desorption of volatiles within a dusty surface layer, dust devils, and/or a thermally unstable boundary layer (reviewed by [GREELEYETAL1992B]).
Accumulations of fine particles deposited and shaped by wind were observed at both Viking Lander sites [BINDERETAL1977; MUTCHETAL1977; SHARP&MALIN1984]. Orientations of drifts correlate reasonably well with highest wind speed directions inferred from wind streaks seen from orbit [SAGANETAL1977]. However, changes to the landing sites during the mission were minor. At the MMS (Mutch Memorial Station, or Viking Lander 1 site) winds perhaps as high as 50 m/sec affected small artificial piles of soil and trenches, but did not perceptibly erode previously undisturbed materials; no wind-related morphological changes at all were observed at the Lander 2 site [ARVIDSONETAL1983; MOORE1985]. Two small mass-movements within drift material were recognized at the MMS [JONESETAL1979; GUINNESSETAL1982], suggesting that inactive drift material is not completely cemented in situ. One of these mass-movements was modified subsequently during the sol 1742 dust storm [MOORE1986]. Dust deposition and subsequent removal of dust by light winds occurred at both landing sites [GUINNESSETAL1982; ARVIDSONETAL1983]. The Viking Meteorology Experiment measured temperatures and wind speeds from a single location 1.6 m above the surface [HESSETAL1977; RYANETAL1978]. Modeling of heat and momentum fluxes within the near-surface boundary-layer was complicated by unknown aerodynamic roughness, z0, [SUTTONETAL1978; HABERLEETAL1993B; TILLMANETAL1994], a limitation of meteorology data being available from only a single height. Under these circumstances values of wind friction speed, u*, were estimated using a range of assumed values of z0. The Pathfinder IMP windsock experiment, with three anemometers, has the potential to remove this ambiguity, providing an independent determination of u* directly from the wind speed profile and allowing more constrained modeling of the atmospheric boundary layer than previously.
An initial test investigated the effect of dust accumulation on calibration stability. A windsock was first calibrated at one atmosphere pressure at speeds causing deflections from 5° to 85°, then was subjected to thick, heavy blowing dust for one hour. The windsock was coated with a patina of dust at the end of the run, but subsequent recalibration showed no change in performance.
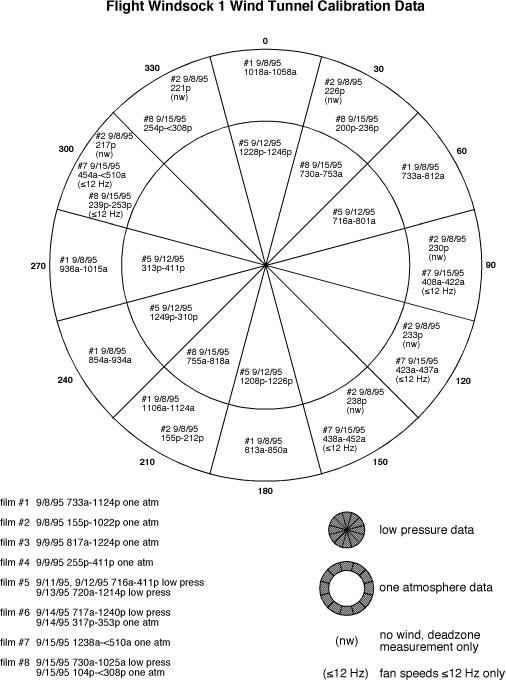
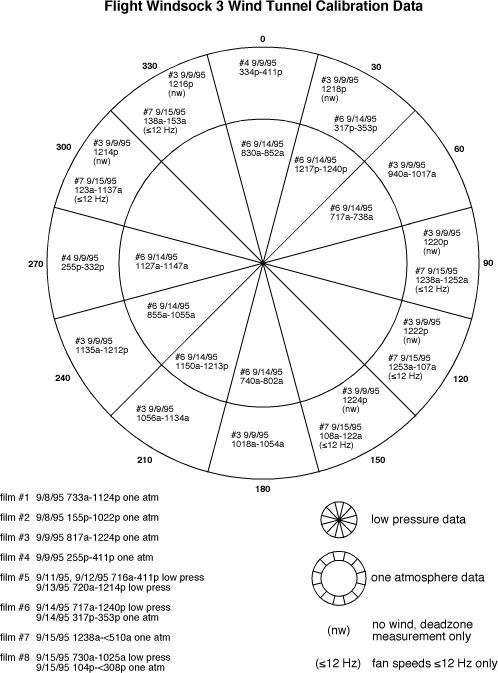
A turntable was used for examining the behavior of each windsock at a range of strut azimuths from the mast relative to the wind direction. The adopted convention is that strut azimuth of 0° extends the windsock strut ahead of the mast, into the wind; 180° azimuth extends the windsock strut directly downwind of the mast, placing the windsock in the mast wake. Strut azimuth relative to the wind increases clockwise when viewed from overhead. During experiments at one atmosphere pressure each flight unit was photographed simultaneously from horizontal and vertical directions at seven strut azimuths and seventeen wind speeds, and at five more strut azimuths at seven wind speeds. Similar experiments were performed at Martian equivalent atmospheric pressure for seven strut azimuths at an average of eleven wind speeds. About 3000 photographs were obtained as part of the calibration process for the three flight units. None of the 1500 vertical (from overhead) pictures revealed any tendency for the windsocks to yaw away from the center of the wind tunnel slip stream. Processed negatives for each of the 1500 horizontal (from the side) photographs were projected to allow measurement of windsock deflection for each wind tunnel speed. Some minor hysteresis (1°-2° of deflection at the lowest wind speeds) was encountered during early experiments, so all data were obtained at both incrementally increasing and decreasing wind speeds. A 'dead zone' deflection (neutral, no wind) of 5°-6° is typical for all three windsocks at all azimuths. Equations (1-2) relate performance between terrestrial calibrations at different conditions, and between all terrestrial calibrations and Martian conditions. Predictions for Martian conditions from terrestrial one-atmosphere and low-pressure experiments plot similarly along the same curve for each flight windsock. Windsock sensitivities for Martian atmosphere and gravity were from 5-40 m/sec. This speed range was most relevant for studying winds strong enough to move loose particles potentially affected by wind. This speed range was also complementary to the single ASI/Met wind sensor, which was optimized for precision measurement of winds <5 m/sec. The most sensitive windsock is unit #1, located at the bottom position of the array, 0.331 m above the solar panel. Flight windsock #2 was mounted in the middle position, 0.624 m above the solar panel. The least sensitive unit, flight windsock #3, was mounted in the top position at 0.916 m above the solar panel.
Calibration data are in Appendix I. None of the images from the vertical (downward-looking) camera are included, as inspection of these images showed no yaw from the wind tunnel centerline. Horizontal (side-looking) pictures are listed by film roll number. Information for each exposure includes windsock flight unit number, date and time of exposure, strut azimuth into wind, temperature, and pressure. If the calibration image was obtained at one atmosphere, wind tunnel fan speed in Hz is listed along with the corresponding laser-doppler velocimeter wind speed at the time of exposure. If the calibration image was obtained at Martian-equivalent pressure, only the wind speed from the laser-doppler velocimeter is listed. Windsock deflection from vertical was measured from every image in at least one trial, and these deflections are also included in Appendix I. It is not practical for the PDS to distribute the original processed film negatives, but they can be examined for additional measurements, if required, by sending email to Dr. Robert Sullivan at sullivan@cuspif.tn.cornell.edu, or regular mail to CRSR, Cornell University, Ithaca, NY 14853 (5/99).
During calibration of the flight model IMP, over 650 IMP windsock images were obtained in a matrix of 36 strut azimuths (0° to 180° in 5° increments) and 18 deflection angles. A matrix of IMP windsock images with varied lighting and background scene entropies was also obtained in order to evaluate practical image compression limits. These auxiliary calibration data showing windsocks at known orientations allow visual comparisons with flight image data obtained on Mars, although this is not necessary for data reduction. As of this writing (5/99) it is uncertain whether these and other preflight IMP calibration images will be included in the IMP PDS distribution.
Windsock images in sequences S0068, S0173, S0174, and S0175 were compressed and tightly subframed to conserve downlink. However, the quality of early images from these sequences was adversely affected by (1) unexplained/unexpected poor performance of the onboard square-root compressor (which converted 12-bit image data to 8-bit data); and (2) unexpected IMP pointing irregularities which led to clipping of the subframed windsocks. These problems were overcome by using only the onboard JPEG image compressor, and increasing the size of the subframe image areas containing the windsocks.
Rover and IMP images show that substantial portions of the airbags were not completely drawn under the ASI/Met mast solar panel. It is likely that unretracted airbag bulk caused aerodynamic interference with the bottom windsock from several wind directions.
All IMP images from all windsock sequences (S0068, S0173, S0174, and S0175) are listed in Appendix II. Images containing windsocks from sequences S0050, S0053, S0055, and S0166 are also listed. Appendix II includes spacecraft clock time, SCLK, and local time of day (LST) for each image.
Recommended Procedure for Deriving Wind Speed and Direction
IMP orientation relative to local Martian vertical can be calculated
from IMP elevation angle and the overall lander tilt obtained during
the mission from onboard accelerometers. This makes windsock
deflection from true local vertical
and azimuth  completely
determinable by geometrically transforming two measurements in IMP
images: (1) apparent foreshortening of the windsock; and (2) clock
angle of the windsock in the plane of the image. Windsock deflection
from vertical can then be converted to wind speed u with equation [1] (using simultaneous ASI/Met temperature
and pressure measurements to calculate density ) and relevant wind tunnel calibration
data. Here is a recommended sequence of steps for obtaining wind
speed and azimuth information from IMP windsock images:
completely
determinable by geometrically transforming two measurements in IMP
images: (1) apparent foreshortening of the windsock; and (2) clock
angle of the windsock in the plane of the image. Windsock deflection
from vertical can then be converted to wind speed u with equation [1] (using simultaneous ASI/Met temperature
and pressure measurements to calculate density ) and relevant wind tunnel calibration
data. Here is a recommended sequence of steps for obtaining wind
speed and azimuth information from IMP windsock images:
 |
| JPEG (35Kb), TIFF (3.4Mb) |
, using the relevant ASI/Met
temperature and pressure data.
 |
 |
 |
| WS1CALIB | WS2CALIB | WS3CALIB |
|---|---|---|
| JPEG (60Kb) TIFF (5.5Mb) |
JPEG (60Kb) TIFF (5.5Mb) |
JPEG (60Kb) TIFF (5.4Mb) |
.
More calibration data were obtained at one atmosphere than at low
pressure, so it is recommended that the one-atmosphere data be used
for interpreting Martian data using equations [1-2]. This is
especially so considering that there are more one-atmosphere
calibration data at the smallest deflections, which were typical
during the quiescent wind conditions at the landing site during
Pathfinder mission operations.
The following links provide some additional information about topics related to the Mars Pathfinder mission. You must be connected to the Internet for most of these links to work, since they are located at the Central Node of the Planetary Data System.